Using Data to Review Marathon Training Execution
Are we training according to plan? Let's see what the numbers say...

The biggest emphasis in my marathon preparation thus far has been to develop aerobic capacity primarily through zone 2 training. For me this is accomplished by any run where I keep my average heart rate at or under 145bpm. After about four months from March to the present, I’m curious to see how things stand and I want to hone my very shoddy data skills.
So there are three methods I’m currently utilizing to gain a better understanding of both my training (am I executing the plan?) and subsequent adaptations (how effective has the plan been?):
Tracking average HR in each session - focused more on proper execution of training
Tracking resting HR - daily monitoring for progress of aerobic capacity
Using a standardized testing protocol to be repeated every 10-14 days - intermittent, task-specific monitoring for progress of aerobic capacity
Over the course of the next week, I’ll break down all three of these. Due to the sensitive nature of HR as it relates to external factors such as sleep, nutrition, weather and daily fluctuation, I think it’s good to check your work via multiple methods.
It is also worth noting, that my zones are predicated off my Max HR (190bpm, which I have hit numerous times in training for several years). I would prefer them to be based off my blood lactate levels and will do that soon.
Today we’ll lead off with a peek at my average HR in each workout over my whole training block.
Ideally, we would like to see average HR in workouts decrease over the course of time. This probably doesn’t indicate increased aerobic efficiency as you'll soon see, but it might inform us as to the precision of our training. Using the quadrant graph (shown below) from Sunday’s post, I decided to eliminate all the yellow dots from this analysis. Those yellow dot runs were all interval based workouts where I was not targeting Z2 training.
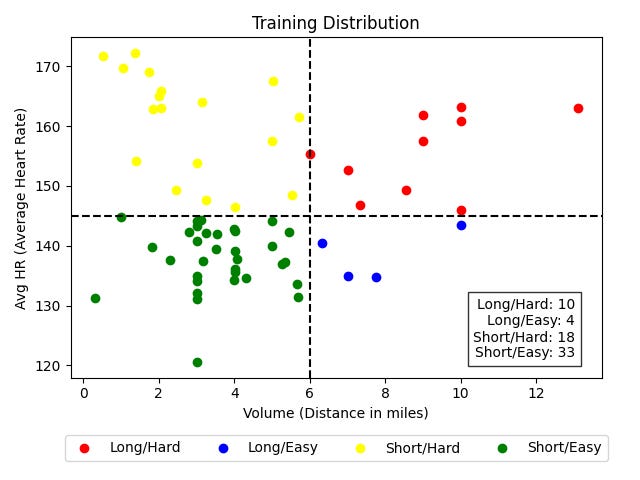
I used the interquartile range method (IQR) to remove any outliers from the remaining data. This eliminated five red dot and two green dot runs. Of the five remaining red dot runs - these were simply long runs where I was targeting Z2 and fell apart as the runs progressed due to fatigue. This left me with 35 runs that qualified as Easy (Avg HR under 145bpm).
Now let’s see how many of my workouts were actually training Z2.
88% of the filtered data set workout fell into Z2. Looking good so far.
57% of my total workouts (including the yellow dots) fell into Z2. This is less good.
Ironically, I don’t think I placed a premium on short, intense interval workouts as I averaged just over one per week these last four months. So three thoughts come to mind:
My poor aerobic fitness made it hard to control heart rate so some of my easier runs ended up being hard.
My overall training frequency isn’t that high so naturally more intense work takes up a disproportionate chunk of the distribution. There were four weeks out of the previous 18 (that’s 20%!) where I only ran twice per week. In fact, 65 runs over 126 days means about half the days in the training window, I didn’t train. It wasn’t until May that I had built up enough of a base to train with more frequency and also realized how key that was.
While my total number of workouts were skewed too far from Z2, total time spent in each zone would likely paint a rosier picture as my more intense work was generally shorter in duration. I’ll check on this in a later post.
So that’s where we stand. Now to check out the filtered data and see what happened to my average HR during workouts over the course of this block.
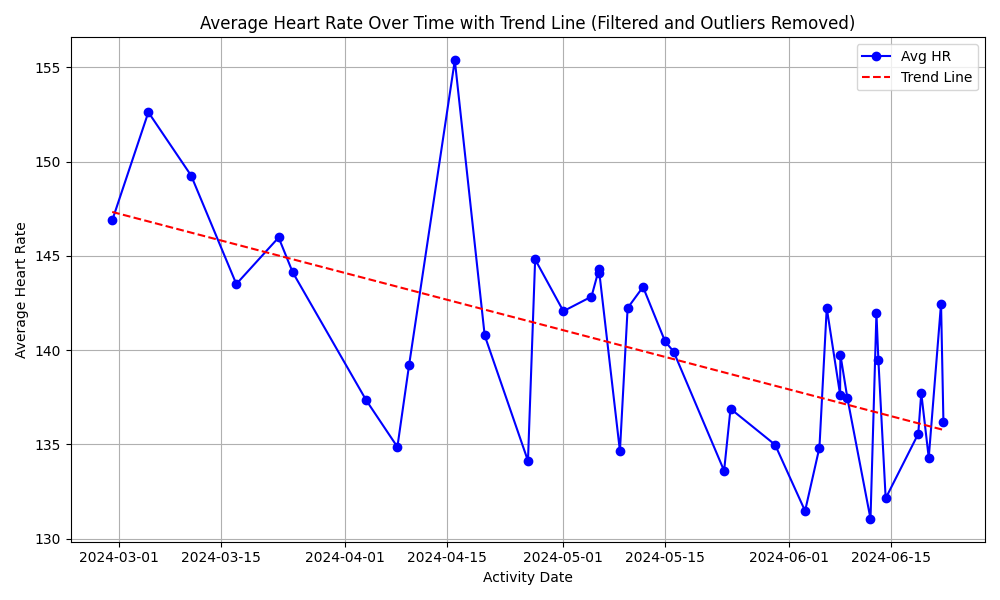
With a trend line dropping about 11bpm from March to June we are on the right track. Initially, I was incredibly out of shape and quite bad at controlling my heart rate (and pace), which didn’t allow me to consistently attack the targeted physiology. However, as time went on, we start to see better execution of Z2 training thanks to:
Running slower
Running shorter distances
Learning how to pace longer distances
Improving fitness/withstanding fatigue
It’s also nice to see that I finally caught on to the importance of training frequency as we start to see more data points piling up in May.
Overall, I feel like this method doesn’t infer much about improved aerobic capacity. Given the varying nature of each run and the fact I’ve provided no data on pace or distance, it’s hard to look at this decline in average HR and attribute it to enhanced aerobic physiology even though I do think it’s a good sign. I do like that it provides a 30,000 foot view of how smart or dumb I am while training. In my case I was dumb early, but wised up around May/June.
My main takeaways:
Continue to increase my frequency so I can accumulate as much time as possible training Z2
Check in on this periodically to ensure my average HR of my easy training keeps trending low
I need to spruce up these insights with pace if I want to infer anything further regarding my aerobic capacity
I will look into using total time spent in each HR zone to better understand the polarization of my training.
Going forward we’ll take a look at daily Resting HR and an aerobic fitness test I recently implemented. Today was about checking our work - doing the work as intended. Later this week, we’ll hone in on identifying potential adaptations from the work.